

Two applications have been developed, one using Django and the other using
Flask:
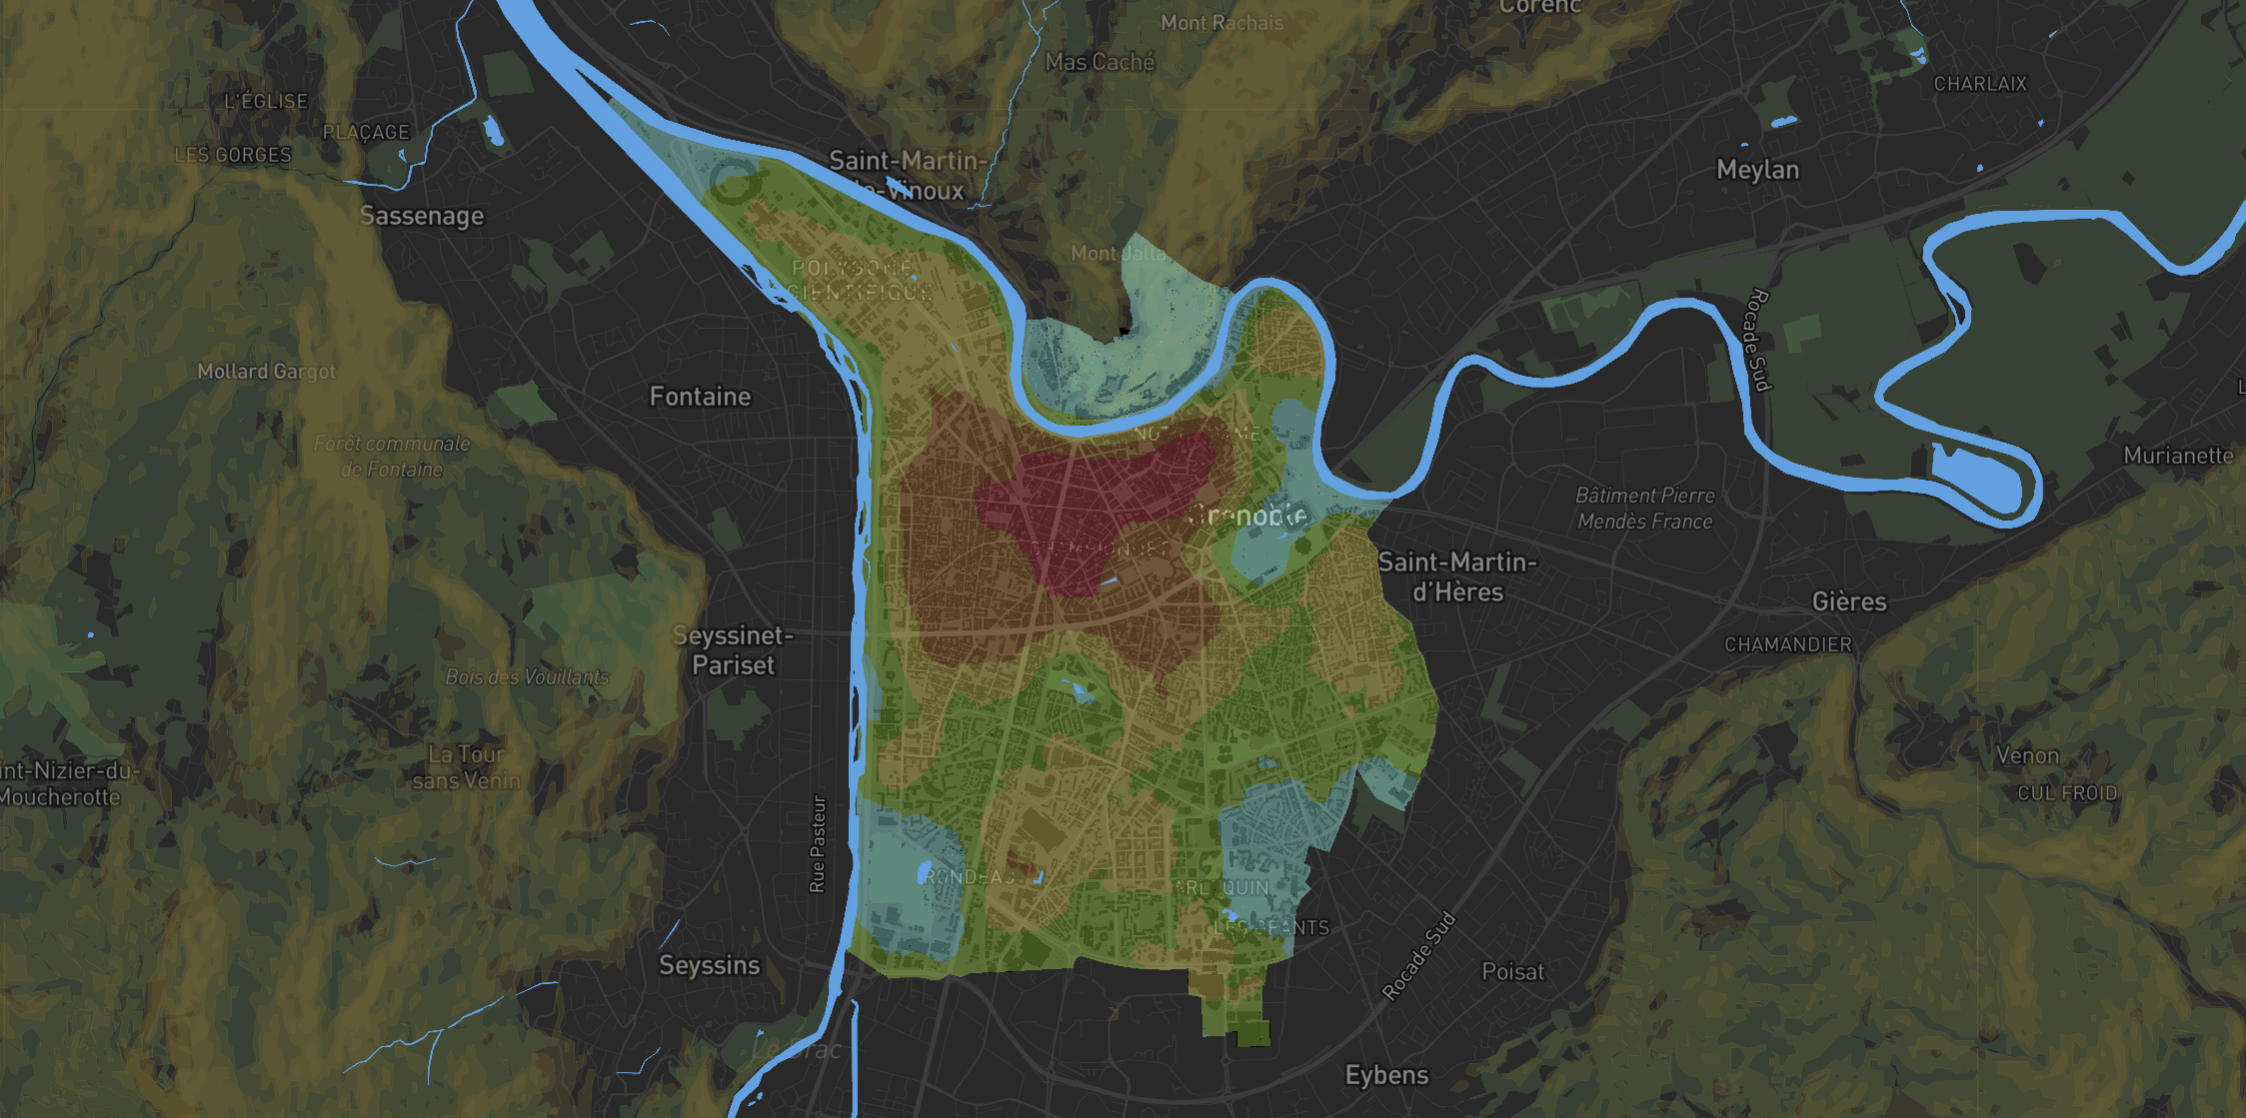
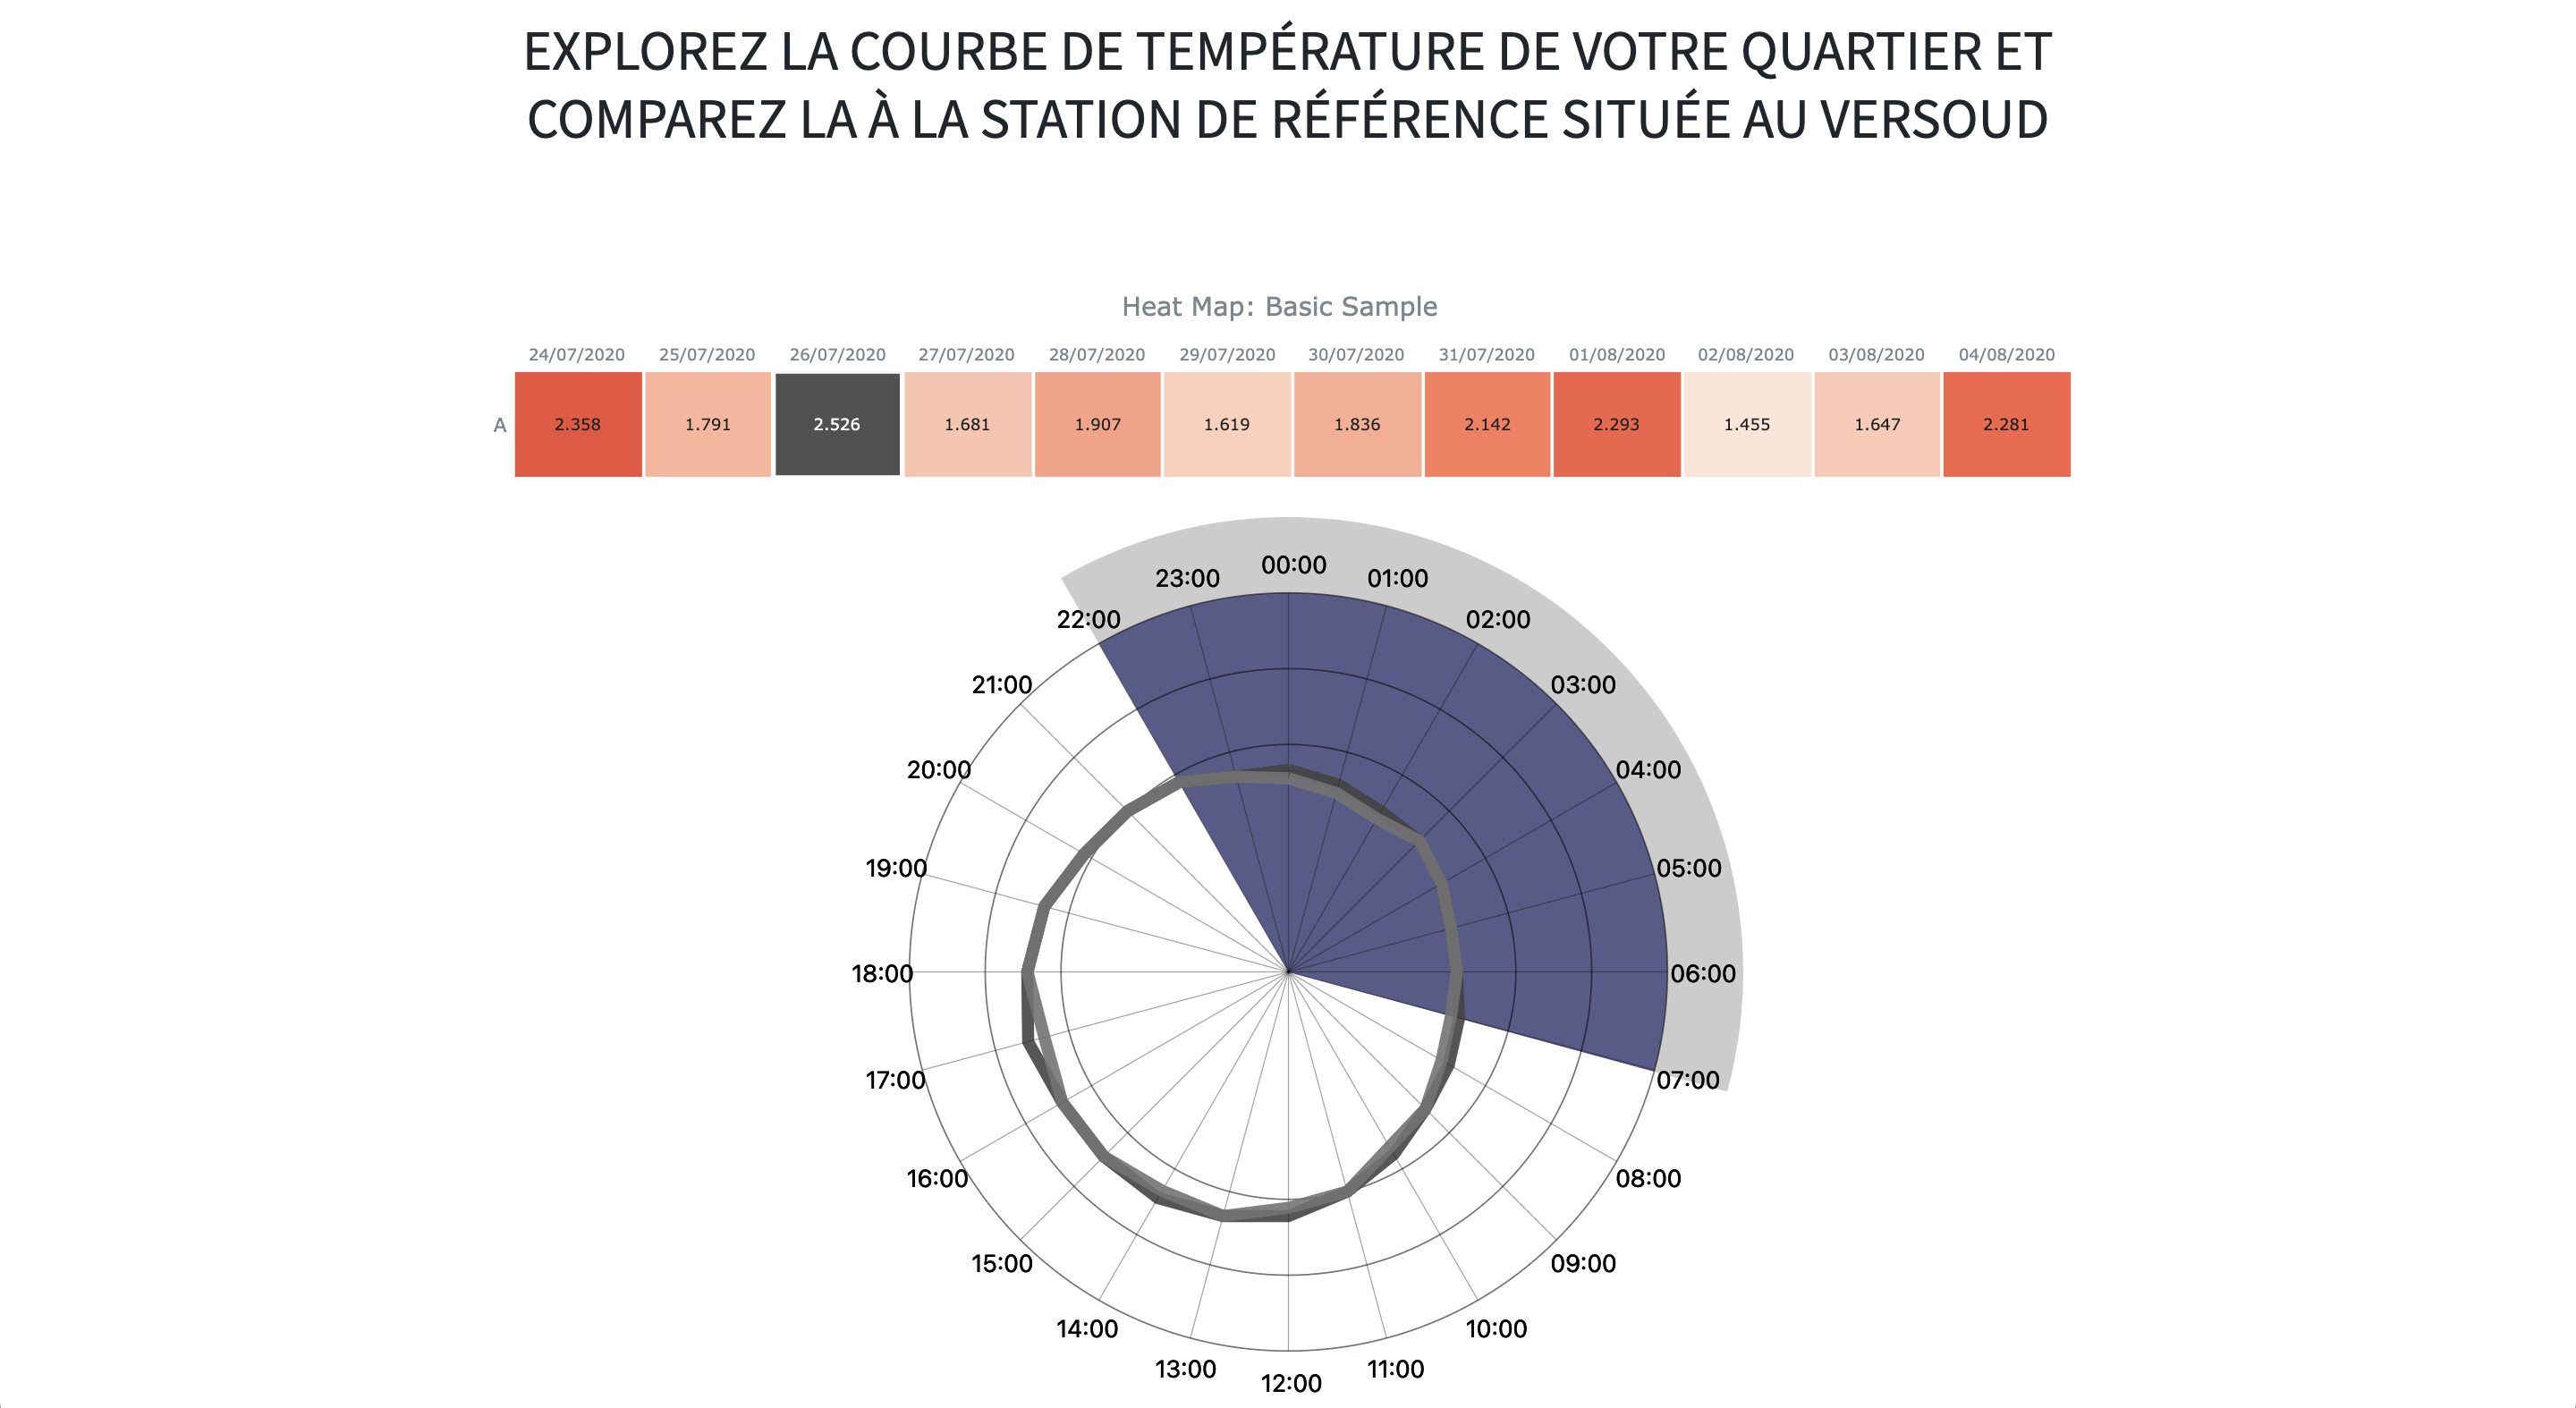
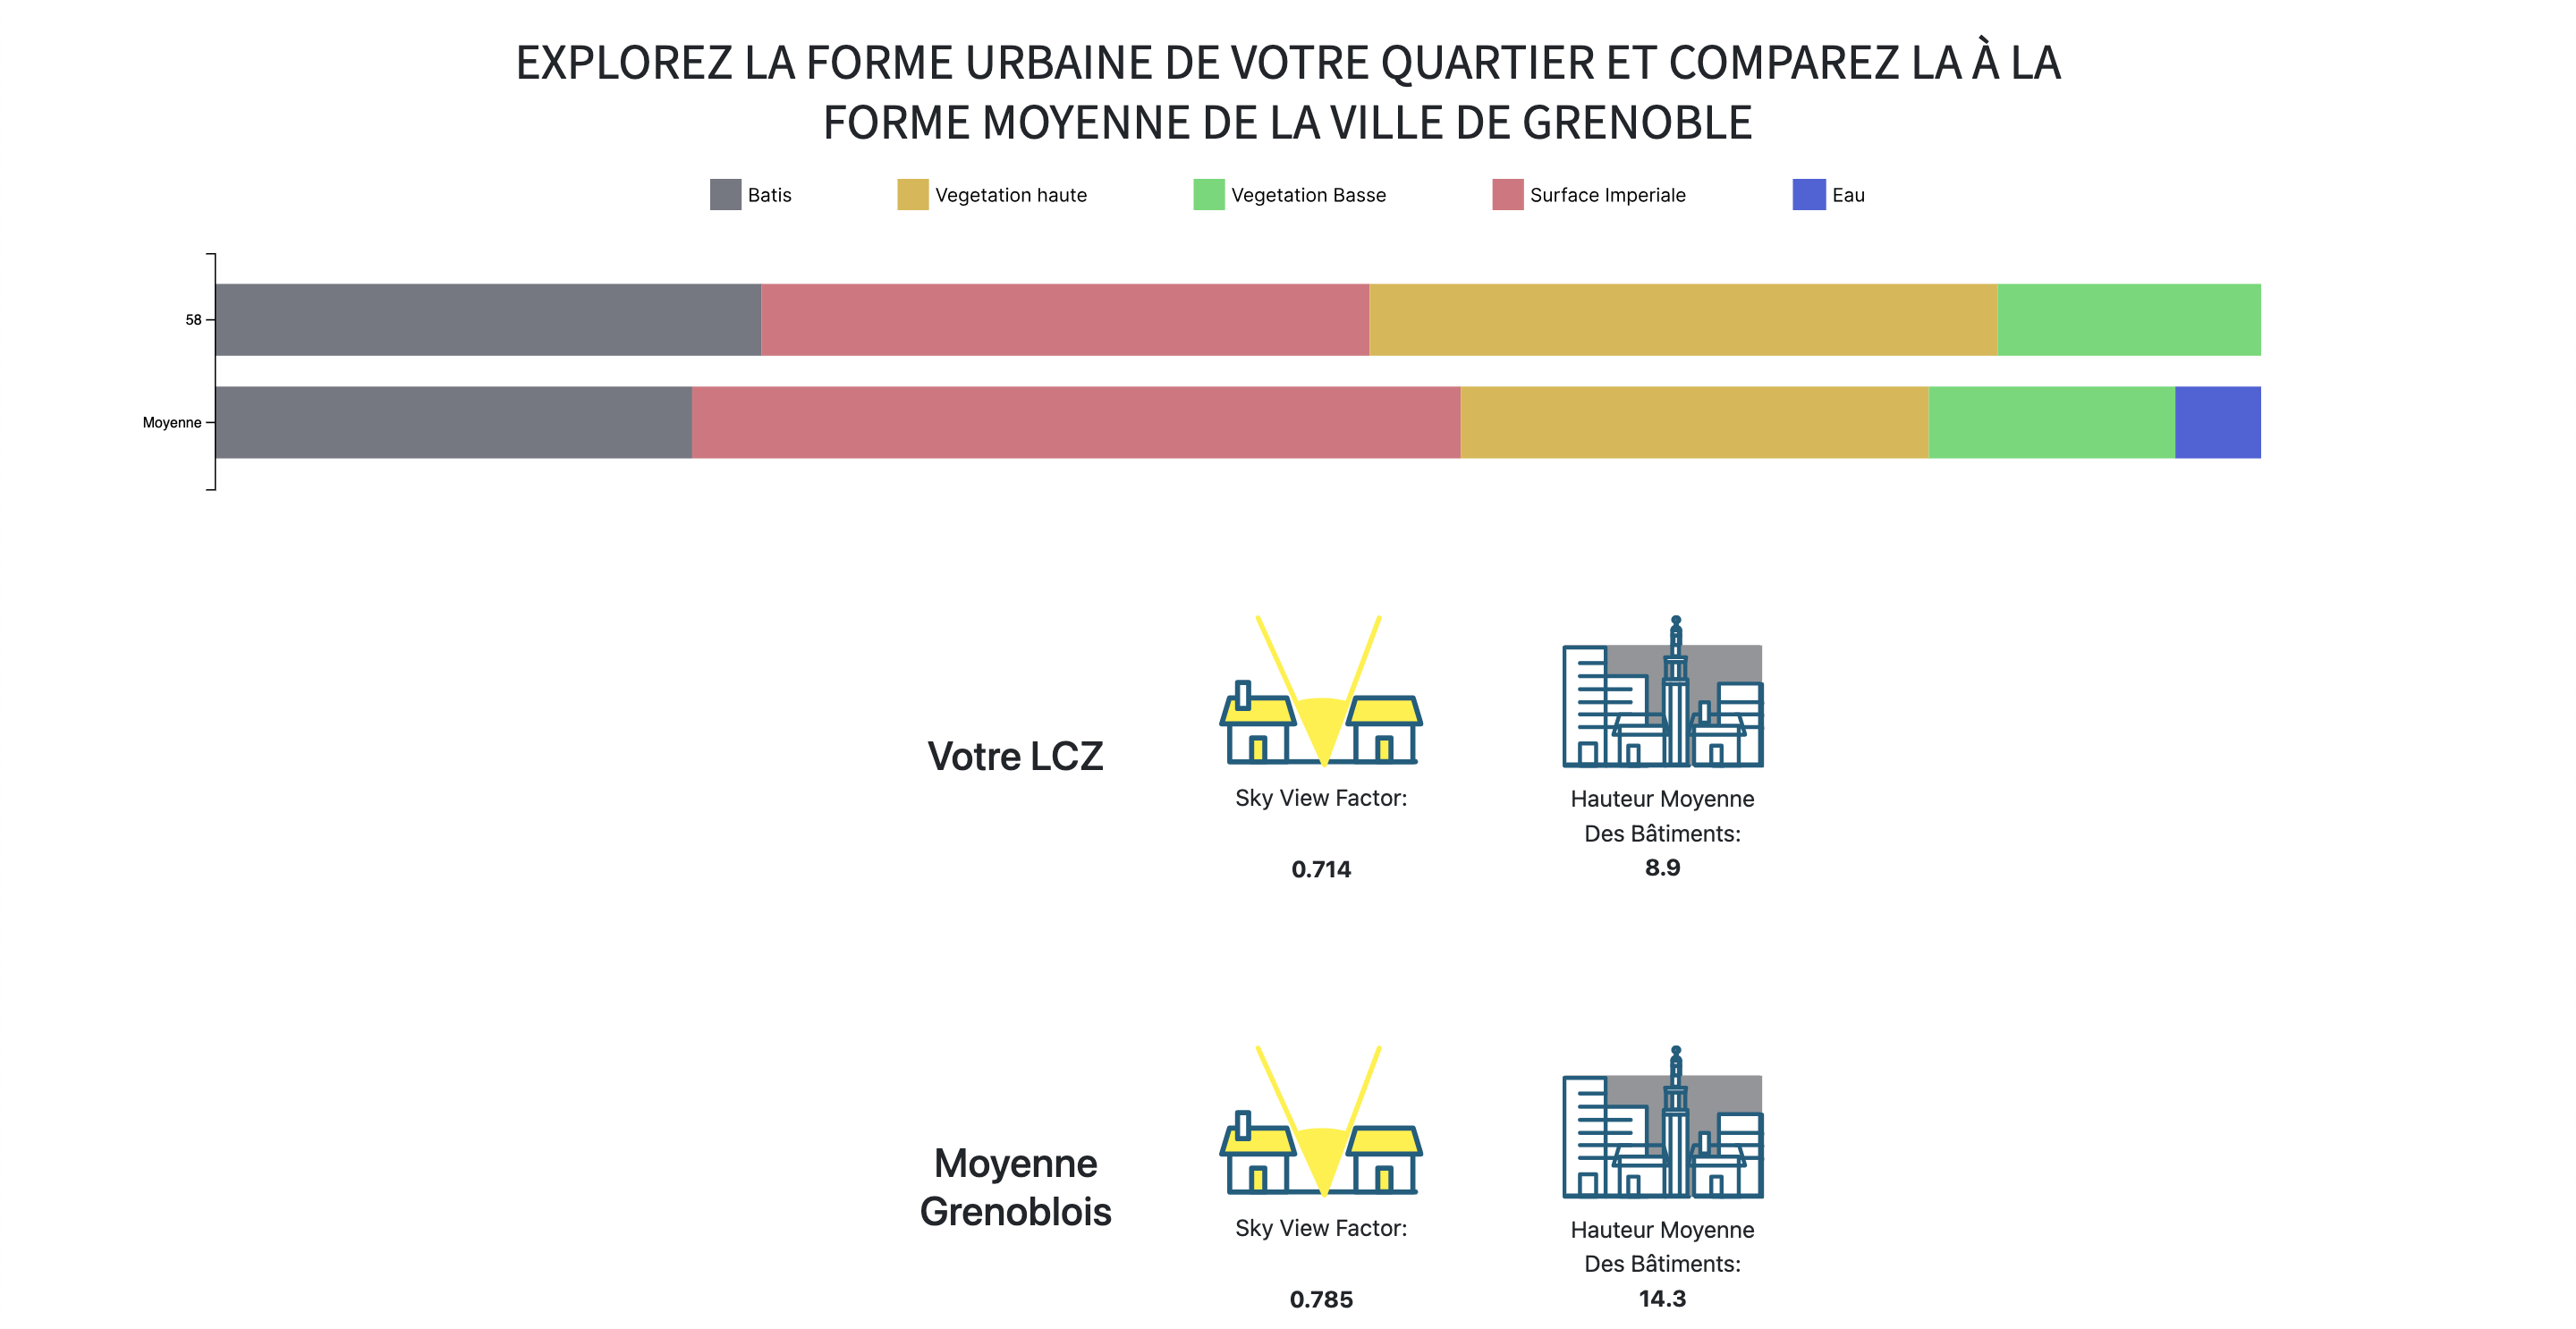
The Flask application is designed to narrate data-driven stories with the
goal of increasing awareness among citizens of Grenoble regarding the
urban heat island phenomenon. It offers interactive and personalized
graphs that are tailored to the user's location. The application utilizes
data provided by the Open Data team of the metropolis, aiming to encourage
various local authorities within the metropolis to make their datasets
available as open data.
The Django application was developed and made accessible to the
municipalities within the Grenoble metropolis with the purpose of
assessing the specific urban heat islands in each municipality. This
estimation serves to alert scientists from the metropolis or the
University of Grenoble Alpes (UGA) in the event of unforeseen results
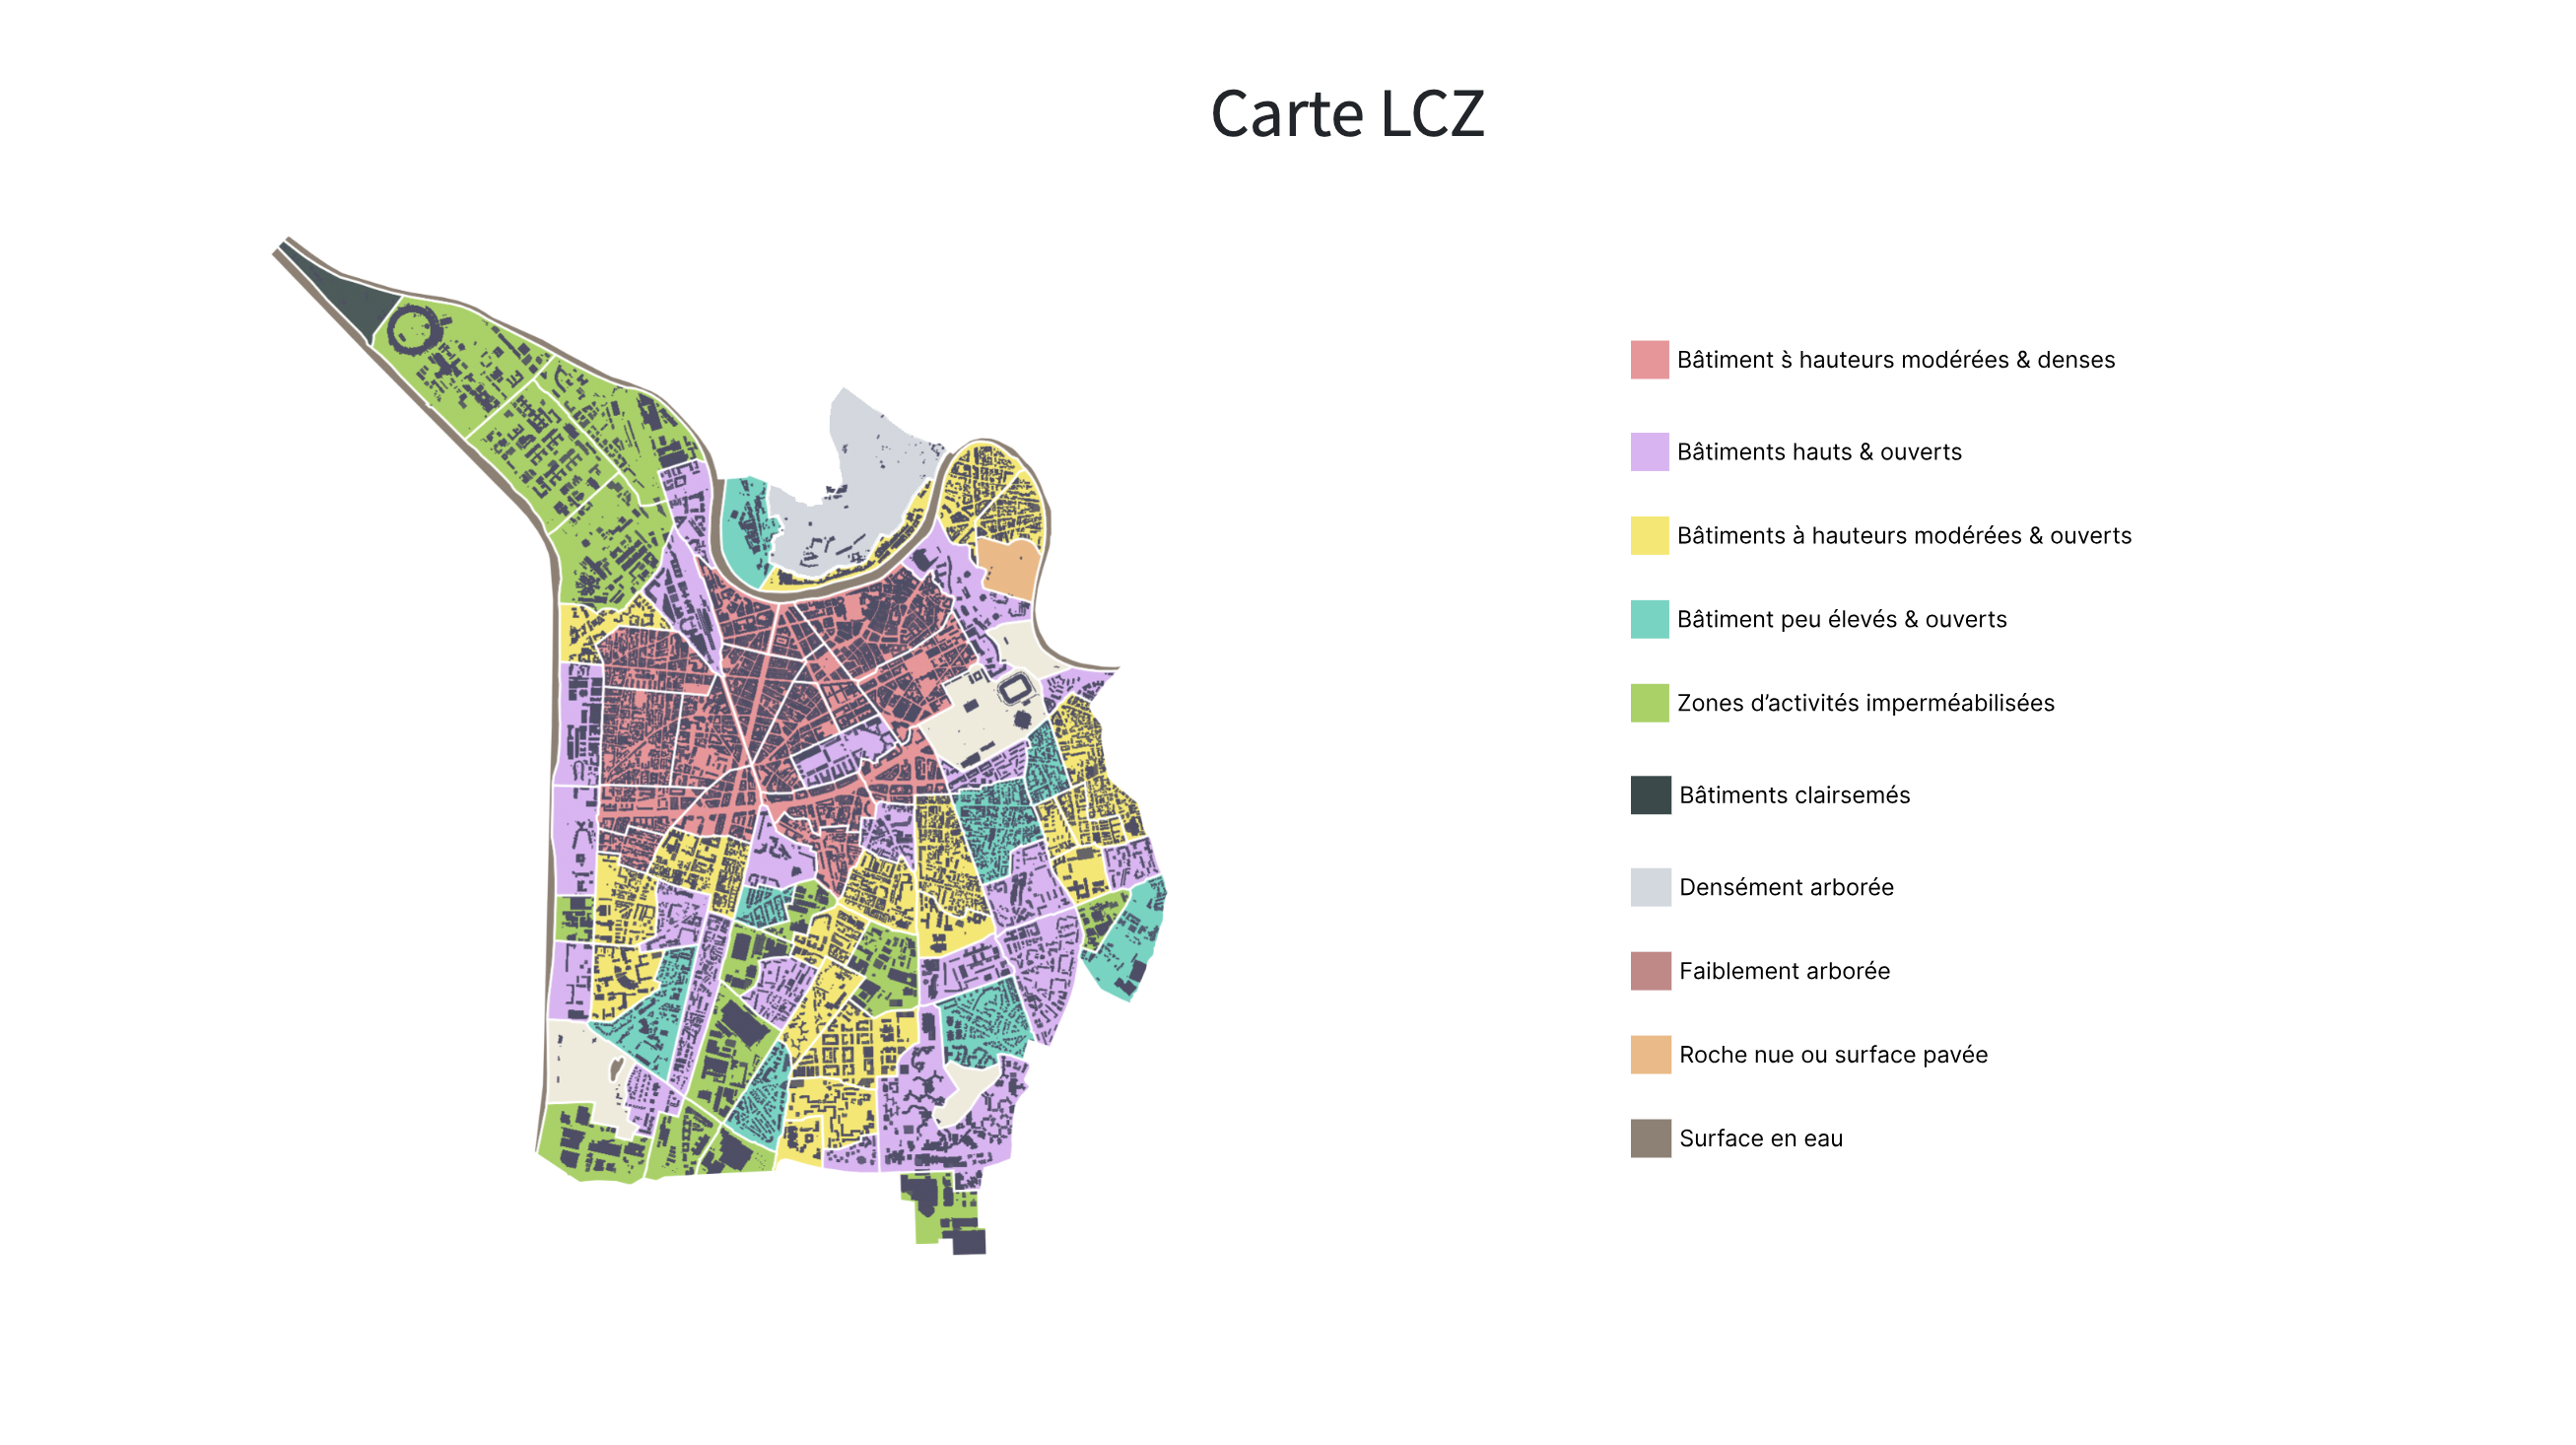
predicted by the two implemented algorithms. The first algorithm utilizes
numerical data as input, while the second algorithm relies on satellite
images. These algorithms determine the classification of each municipality
from the 5 classes that were collaboratively established with the
metropolis's scientists. Each class represents a temperature difference
range between a reference city (used for comparison) and Grenoble,
considering various criteria selected by the metropolis's scientists.
You can find the beta version of the application at the following 2 links:
https://data.metropolegrenoble.fr/visualisation_tdb/ilot_chaleur_urbain?
https://aissatheprogrammer.github.io/icu_website/
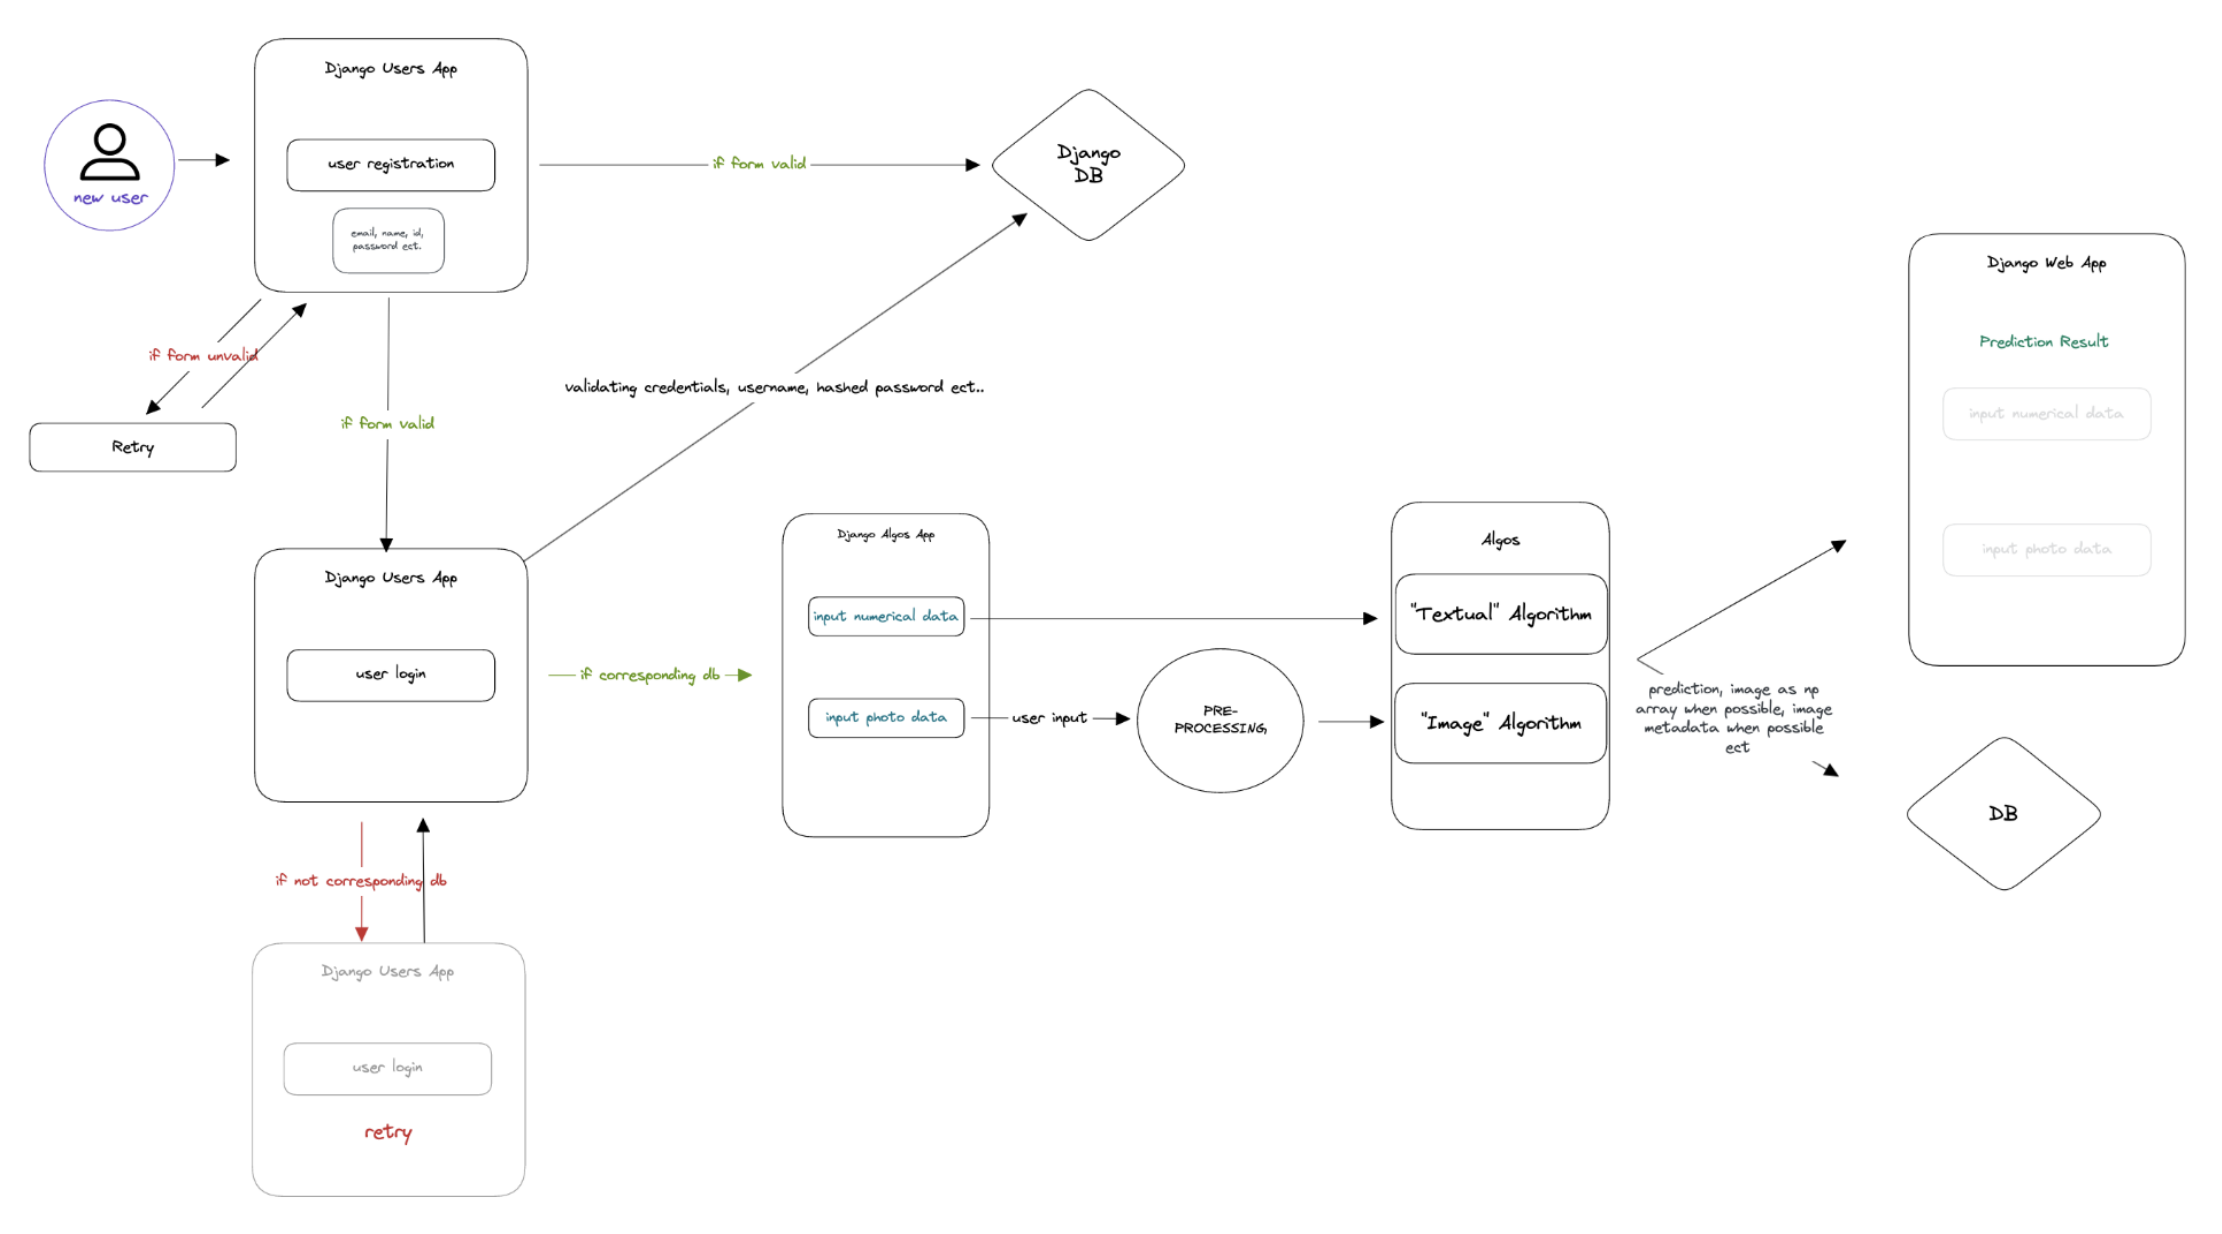
The second application created with Django was intended for the local
authorities of the Metropolis, where we needed a part to manage user
access, their registration, as well as an administration page to manage
their rights. That's why I chose to use Django, as it greatly
facilitates these functionalities. In addition to that, I implemented
two types of algorithms once the user accesses the site.
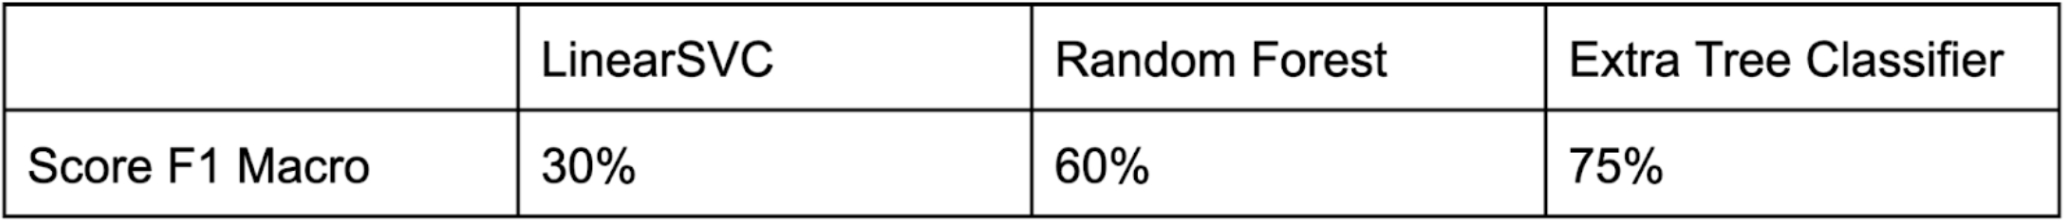
The first algorithm used is an Extra Tree Classifier, which is used for
numerical data.
The second algorithm takes a satellite image of a neighborhood as input
to predict its urban heat island value. I use MobileNet for feature
extraction from the image and an XGBClassifier algorithm for prediction.
The latter gives me a macro f1 score of 100%.
I invite you to check the
following link
for more details on the steps taken(in French).